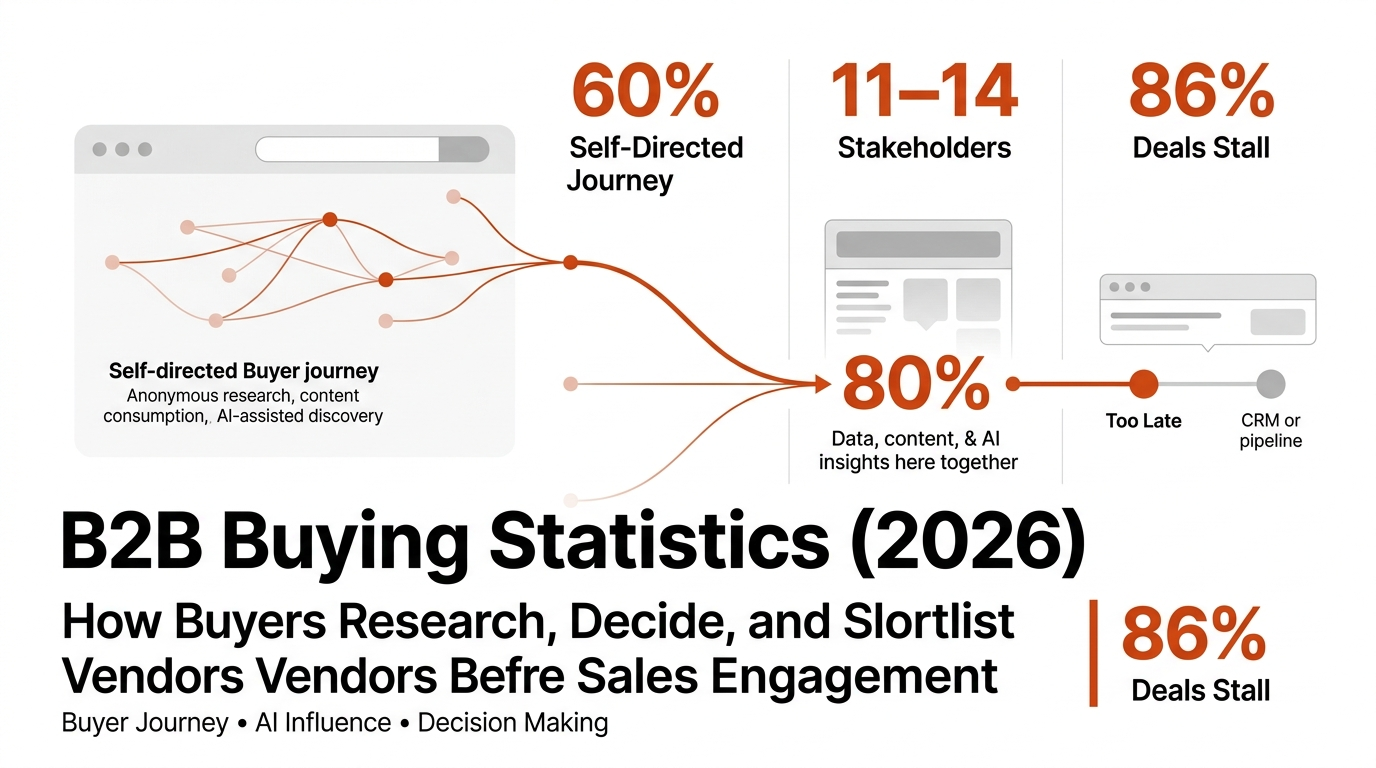


80% of B2B deals are won by the vendor the buyer favored before ever contacting sales — and that shortlist forms during an anonymous, self-directed research phase that most sellers never see (6sense, 2025 Buyer Experience Report). The modern B2B buying journey has structurally reorganized: 92% of buyers begin their journey with a vendor in mind, and 95% of winning vendors are already on the buyer's "Day One" shortlist. Buyers complete 60% of their journey independently, AI chatbots are now the single biggest influence on vendor shortlists, and buying committees have grown to an average of 11–14 internal stakeholders on complex purchases. Buying cycles and sales cycles are being compressed and accelerated, with economic uncertainty and economic pressure driving faster decision timelines and more cautious, reactive vendor selection. Forrester’s State of Business Buying 2024 found that 86% of B2B purchases stall during the process and 81% of buyers are dissatisfied with their chosen provider (Forrester, December 2024) — a dissatisfaction rate that points directly to a content and context problem, not a product problem. We aggregated data from 6sense, McKinsey, Forrester, Gartner, G2, TrustRadius, Demandbase, Consensus, and a dozen other primary sources to compile the most comprehensive B2B buying statistics for 2026.
Key Takeaways
- 80% of B2B deals are won by the vendor the buyer preferred before first contact with any seller (6sense, 2025 Buyer Experience Report)
- Buyers complete 60% of their journey in independent research before engaging any vendor (6sense, 2025 Buyer Experience Report)
- GenAI chatbots are now the #1 source influencing B2B vendor shortlists, cited by 17.1% of buyers — above vendor sites (12.8%) and peers (8.9%) (G2, 2025 Buyer Behavior Report)
- Average B2B buying group: 13 internal stakeholders and 9 external participants on complex purchases (Forrester, State of Business Buying 2026)
- 86% of B2B purchases stall during the buying process; 81% of buyers are dissatisfied with their chosen provider (Forrester, State of Business Buying 2024)
- B2B buyers use an average of 10.2 interaction channels during the buying journey, up from 5 in 2016 (McKinsey, B2B Pulse Survey 2024)
- More than half of large B2B transactions ($1M+) will be processed through digital self-serve channels by 2025 (Forrester, B2B Marketing and Sales Predictions 2025)
- 94% of B2B buyers used LLMs during their most recent purchase process (6sense, 2025 Buyer Experience Report)
- Millennials and Gen Z now make up 71% of B2B buyers, up from 64% in 2022 (Sopro, State of Prospecting 2025)
- 87% of B2B buyers want to self-serve part or all of their buying journey (TrustRadius, B2B Buying Disconnect)
- Buyers spend just 17% of their total buying time meeting with potential suppliers (Gartner, Future of Sales 2025)
- Two-thirds of B2B buyers now prefer engaging vendor salespeople only in the later stages of the journey, up 17 percentage points from 2024 (G2, 2025 Buyer Behavior Report)
- 6sense — 2025 Buyer Experience Report (November 2025, n=4,510 B2B buyers, North America, EMEA, APAC); 2024 Buyer Experience Report
- McKinsey & Company — B2B Pulse Survey 2024 (n=3,942 B2B decision-makers, 13 countries); 2024 B2B Decision-Maker Pulse Survey
- Forrester — The State of Business Buying, 2024 (December 2024); The State of Business Buying, 2026 (January 2026, Buyers' Journey Survey 2025); B2B Marketing and Sales Predictions 2025 (October 2024)
- Gartner — Future of Sales 2025: Why B2B Sales Needs a Digital-First Approach (September 2020 — most recent available on this specific data point); Gartner Says By 2030 75% of B2B Buyers Will Prefer Human Interaction (August 2025)
- G2 — 2025 Buyer Behavior Report: AI Now Means Always Included (May 2025, n=1,169 B2B decision-makers, global, via BusinessWire); 2024 Buyer Behavior Report
- TrustRadius — 2025 Buyer Research: Bridging the Trust Gap; 2024 B2B Buying Disconnect: The Year of the Brand Crisis; Gen Z Buyers Report 2025
- Demandbase — 2025 B2B Buying Group Research (buying group complexity and decision-making evolution)
- Sopro — The State of Prospecting 2025 (proprietary buyer survey + aggregated primary data)
- Consensus — 2026 B2B Buyer Behavior Report (6 million buyer interactions analyzed)
- Emblaze — 2024 Seller-Buyer Alignment Research (problem definition misalignment and win rate data)
- Digital Applied — B2B Marketing Statistics 2026, aggregating Forrester, 6sense, Gartner CMO Survey with methodology disclosed
- Inbox Insight / The Insight Collective — B2B Tech Buying Behavior 2025 (n=800+ B2B buyers, US and EMEA)
- The Gartner "80% of B2B sales interactions in digital channels by 2025" prediction was made in September 2020. The underlying directional data has been confirmed by McKinsey's 2024 B2B Pulse Survey. No more recent Gartner publication supersedes this specific figure.
- Emblaze's 54.5% problem definition misalignment figure is from 2024. No 2025–2026 update was available at time of publication.
The Self-Serve Research Phase: How Shortlists Form Before Sellers Appear
The B2B buying journey does not begin with a sales call. It begins with a search — in Google, in ChatGPT, in Perplexity, on G2 — conducted by buyers who will never announce themselves until they have already formed a preference. Buyers’ prior purchase journeys and prior experience with vendors heavily influence the formation of the preferred vendor and Day-One shortlist. 95% of the time, the vendor that wins the deal was already on the buyer’s Day-One shortlist, and 80% of sellers contact the vendor they intend to buy from first (6sense, 2025 Buyer Experience Report). The compression of this phase — from a 70/30 research-to-engagement split in 2024 to a 60/40 split in 2025 — is not because buyers are doing less research. It is because AI tools have made them faster. Shortlists form earlier, harder, and with less opportunity for late-entering vendors to influence them. Buyers prefer a self-directed, digital-first approach, gathering information independently and often establishing a preferred vendor before any sales interaction.

|
Metric |
Value |
Source |
|
Deals won by pre-contact vendor favorite |
80% |
|
|
Winning vendor already on Day-One shortlist |
95% of the time |
|
|
Share of buying journey in independent research |
60% (down from 70% in 2024) |
|
|
Buyers who define requirements before contacting sales |
83% |
|
|
Buyer-initiated first contact with sellers |
~80% of conversations |
|
|
Point of first seller contact in 2025 (share of journey elapsed) |
61% (vs. 69% in 2024) |
|
|
Average buying cycle length (2025) |
10.1 months |
|
|
Average buying cycle length (2024) |
11.3 months |
|
|
Buyers who prefer rep-free buying experience |
33% overall; 44% of millennials |
Key points: Most buyers define their purchase requirements and create an internal vendor shortlist before engaging sellers, making it critical for vendors to be discovered early. The vendor ranked first at the end of the selection phase is a strong predictor of the final decision. Buyers discover new vendors primarily through digital channels, so an effective outreach strategy and lead generation approach across social media and other platforms is essential. Buyers prefer educational digital content over ads, with over half willing to exchange contact details for valuable resources; just over half of B2B marketers utilize e-books and white papers as part of their content strategy.
The compression of the buying cycle from 11.3 to 10.1 months is not a signal that buyers are less rigorous. 6sense’s data shows buyers evaluated slightly more vendors in 2025 while completing the journey faster. The compression is driven by AI-assisted research, not reduced due diligence. Buyers arrive at first contact more informed, more committed to a shortlist, and with less appetite for early-stage vendor education.
Understanding which accounts are in this anonymous research phase — before they raise their hand — is exactly what Omnibound’s Intelligent Research is built for, surfacing ICP signals and in-market buyer intent before any contact is made.
Buying Committees: Size, Structure, and Who Actually Decides
Formal buying committees have given way to fluid, cross-functional networks of influence — and those networks are larger than at any point in recent history. Forrester’s 2025 Buyers’ Journey Survey found that the average B2B purchase now involves 13 internal stakeholders and 9 external participants, up from prior years, with public sector purchases averaging 14 internal stakeholders (Forrester, State of Business Buying 2026). The growth of buying committees is not merely a complexity problem — it is a content problem. Every additional stakeholder represents a distinct set of questions, success metrics, and risk tolerances that content must address before consensus forms. The decision making process in B2B buying is increasingly complex, as multiple stakeholders are typically involved from departments such as IT, finance, operations, and leadership. Aligning and managing internal teams within these decision-making units is critical, requiring tools and strategies that facilitate collaboration and coordination among all internal stakeholders.

|
Metric |
Value |
Source |
|
Average internal stakeholders in a B2B purchase (complex deals) |
13 internal + 9 external |
|
|
Median buying group size for deals over $50K |
11.2 stakeholders (up from 9.7 in 2024) |
|
|
B2B purchases involving high-complexity buying groups |
72% |
|
|
Buying groups actively evolving their decision-making models |
54% |
|
|
Unique decision-maker functions in modern buying groups |
10 |
|
|
Purchases requiring CFO approval |
79% |
|
|
Buying groups including decision-makers at VP level or above |
52% |
|
|
Average buying group for complex B2B solutions |
8.2 stakeholders (up 21% since 2015) |
|
|
Average sales cycle: mid-market |
121 days |
|
|
Average sales cycle: enterprise |
218 days |
Younger buying leaders compound the committee complexity. Forrester’s research shows buyers under 40 involve nearly twice as many stakeholders (6.8) as executives over 40 (3.5) (Sopro, State of Prospecting 2025). As millennials and Gen Z become the majority of B2B buyers — 71% combined as of 2025 — committee sizes are likely to continue growing, and the content demands of each committee member will increase accordingly.
AI in the Buying Process: Research, Shortlisting, and Validation
AI has moved from an experimental research tool to the primary driver of vendor shortlisting. GenAI chatbots are now the single most influential source for B2B vendor shortlists at 17.1%, ahead of software review sites (15.1%), vendor websites (12.8%), and peer recommendations (8.9%) (G2, 2025 Buyer Behavior Report). The practical implication: a vendor that does not appear in AI-generated answers for their category’s core buying questions is invisible at the moment when shortlists form. Simultaneously, Forrester’s 2025 data shows that buyers use AI as a starting point but turn to peers and experts to validate what AI produces — creating a two-step research process where AI determines the consideration set and human social proof determines the final selection.
Nearly all buyers now expect vendors to clarify AI capabilities and demonstrate robust AI features and AI capabilities in their solutions. Technology buyers, in particular, scrutinize AI features and capabilities during the evaluation process, making it essential for vendors to clearly communicate and validate their AI offerings.

|
Metric |
Value |
Source |
|
B2B buyers using LLMs during their purchase process |
94% |
|
|
GenAI chatbots as #1 source influencing vendor shortlists |
17.1% of buyers |
|
|
Software review sites as #2 shortlist influence |
15.1% of buyers |
|
|
Buyers who say AI search changed how they conduct research |
8 in 10 (80%) |
|
|
Buyers who now start research via LLMs more often than Google |
29% |
|
|
Buyers who encountered Google AI Overviews during research |
72% |
|
|
Buyers who clicked through to a cited source from AI Overviews |
90% |
|
|
Buyers who find AI makes it easier to find information |
40% |
|
|
Buyers who trust AI tools at least sometimes (up 19 points YoY) |
80% |
|
|
Buyers who felt less confident due to AI inaccuracies |
20% |
The trust gap in AI-assisted research is the defining tension for B2B marketers in 2026. 80% of buyers trust AI tools at least sometimes, but 20% say AI made them less confident due to unreliable information. This means credibility — being the source AI cites, not just the source AI describes — is the highest-leverage content investment a B2B brand can make. Being cited creates trust; being summarized without a citation does not.
Omnibound’s Intelligent Research surfaces the specific AI search prompts buyers in your ICP are typing when evaluating your category — so your content strategy targets the exact moments where shortlists form.
Digital Channels and the Omnichannel Buying Journey
The channel mix of the B2B buying journey has doubled in a decade. B2B buyers now use an average of 10.2 interaction channels during a purchase, up from just 5 in 2016 — and more than half would switch suppliers if the experience across those channels was poor (McKinsey, B2B Pulse Survey 2024). Gartner’s prediction — that 80% of B2B sales interactions would occur in digital channels by 2025 — has effectively been confirmed by the data, and McKinsey’s rule of thirds (one-third in-person, one-third remote, one-third digital self-serve) now governs every stage of the purchasing journey and every buyer archetype, regardless of deal size or geography.
A significant trend is the rise of self service digital purchases, with many buyers preferring a rep free sales experience. However, this shift increases the risk of purchase regret when buyers lack guidance or support during the sales process. While digital self-service is popular, the involvement of sales reps and sales teams remains crucial for complex purchases, helping to build buyer confidence and provide personalized assistance. The evolving sales process now requires a careful balance between digital self-service and human support to ensure buyers are confident and satisfied throughout their purchasing journey.

|
Metric |
Value |
Source |
|
Average interaction channels used by B2B buyers (2024) |
10.2 (up from 5 in 2016) |
|
|
B2B buyers who would switch suppliers for poor omnichannel experience |
54% |
|
|
B2B sales interactions in digital channels by 2025 |
80% (Gartner prediction, confirmed) |
|
|
Large B2B transactions ($1M+) via digital self-serve channels |
>50% |
|
|
B2B buyers spending $500K+ via self-service or remote interactions |
39% (up from 28% two years prior) |
|
|
Share of B2B revenue from self-service + remote online channels |
34% |
|
|
Buyers spending time on digital self-service during buying journey |
~33% of interaction time |
|
|
Omnichannel leaders’ market share growth advantage |
Up to 70% higher |
|
|
B2B buyers who turn to online channels first to find suppliers |
90% |
McKinsey’s “rule of thirds” — buyers allocating roughly equal time to in-person, remote, and digital self-serve interactions — is the most practically useful framing in this dataset. It holds across all industries, geographies, and deal sizes. The implication is that a channel strategy that neglects any of the three thirds leaves meaningful buyer interaction surface uncovered.
Generational Shifts: Millennial and Gen Z Buyers Reshape the Process
The generational handover in B2B buying is complete. Millennials and Gen Z now represent 71% of all B2B buyers (Sopro, State of Prospecting 2025), and their preferences — self-serve research, peer validation over analyst reports, AI-first discovery — are now the default buying behavior, not a generational outlier. Nearly three quarters of buyers begin their research online, making digital presence and content critical in the purchasing process. For the first time in 2025, Gen Z buyers surpassed Baby Boomers in TrustRadius’s annual survey, and the data shows Gen Z trusts AI-generated content at nearly twice the rate of older generations. The marketing playbooks built for Baby Boomer and Gen X decision-makers — analyst reports, cold outreach, vendor-led demos — consistently underperform with the buyers who now hold purchasing authority.
Younger buyers are especially diligent in their research, particularly when significant investments are at stake, requiring careful evaluation and thorough due diligence. Reading user reviews and seeking peer validation have become essential steps, as social proof and feedback from current users strongly influence trust and decision-making. Companies that demonstrate thought leadership and establish a strong brand presence early gain a competitive advantage, attracting high-level engagement and increasing their chances of winning deals before direct seller interaction.

|
Metric |
Value |
Source |
|
Millennials and Gen Z share of B2B buyers (2025) |
71% (up from 64% in 2022) |
|
|
Gen Z buyers surpassing Boomers in the workforce |
First occurred in 2025 (9% vs. 6%) |
|
|
Gen Z buyers who trust AI-generated content “always” or “very often” |
30% (vs. 20% of all buyers) |
|
|
Gen Z use of AI tools in buying process vs. average buyers |
15% “use a lot” vs. 8% average |
|
|
Millennial buyers who prefer self-serving part or all of their journey |
87% |
|
|
Younger decision-makers (under 40): stakeholders involved |
6.8 (vs. 3.5 for executives over 40) |
|
|
Millennial buyers: likely to discover products by searching online |
2× more likely than older generations |
|
|
Younger B2B buyers relying on 10+ external influencers |
>50% |
|
|
Use of analyst rankings and reports (all buyers) |
16% — lowest in 7 years |
The decline of analyst reports as a buyer resource is one of the clearest generational signals in this dataset. Analyst rankings have dropped to 16% usage — the lowest in 7 years of TrustRadius tracking — driven largely by younger buyers who trust peer content, AI tools, and G2/TrustRadius reviews over formal analyst firms. Budgets still flowing into analyst relations as a primary awareness and influence channel are increasingly misallocated for the buyers who now hold purchasing authority.
Omnibound’s AI Content Marketing Platform helps B2B teams build the kind of peer-credible, AI-discoverable content that resonates with the 71% of buyers who now prefer to research without vendor involvement.
Buyer Dissatisfaction and the Stalled Purchase Problem
The headline stat from Forrester’s State of Business Buying 2024 should stop every B2B marketing and sales leader: 86% of B2B purchases stall during the buying process, and 81% of buyers are dissatisfied with the provider they ultimately chose (Forrester, December 2024). These are not product failures — they are buying experience failures. Most buyers form opinions early in the process, and prior experience with vendors heavily influences purchasing decisions. Nearly two thirds of buyers are already midway through their decision-making process before they ever engage with sellers. Buyers arrive with AI-synthesized research, pre-formed preferences, and high expectations of vendor context-awareness. When vendors fail to demonstrate that they understand the buyer’s specific problem in digital interactions, buyers disengage. The companies winning in this environment are not necessarily selling better products — they are providing better context, earlier, in the channels where buyers research independently. Notably, the number of buying group members per vendor evaluated has remained essentially unchanged from previous years, even as other aspects of the buying cycle evolve.

|
Metric |
Value |
Source |
|
B2B purchases that stall during the buying process |
86% |
|
|
Buyers dissatisfied with their chosen provider |
81% |
|
|
Buyers who expect ROI within 3 months of a software purchase |
57% |
|
|
Buyers who expect ROI immediately |
11% |
|
|
Misalignment between how sellers and buyers define the core problem |
54.5% average |
|
|
Win rate improvement when sellers and buyers align on problem definition |
38% |
|
|
Buyers who adjusted buying process to ensure mission-critical ROI |
87% |
|
|
Buyers who want vendors to understand challenges via digital interactions before sales |
74% |
|
|
B2B buyers who would switch suppliers for a better experience |
75% |
The 54.5% seller-buyer problem misalignment figure from Emblaze is one of the most commercially significant findings in this section. When sellers and buyers don’t agree on what problem is being solved, win rates drop by up to 10 percentage points. When they do align, win rates improve by 38%. The practical implication: context-rich content that demonstrates a clear understanding of the buyer’s problem before the first sales conversation is the highest-leverage conversion investment in B2B.
Omnibound’s Marketing Context Engine unifies ICP data, buyer signals, and competitive intelligence so every piece of content and every sales conversation starts from a shared understanding of the buyer’s actual problem — not a generic pitch.
B2B Buying by the Numbers: Summary Table
|
Metric |
Value |
Source |
|
Deals won by pre-contact vendor favorite |
80% |
|
|
Winning vendor already on Day-One shortlist |
95% of the time |
|
|
Share of buying journey in independent research |
60% |
|
|
Average buying cycle length (2025) |
10.1 months |
|
|
Average interaction channels per buyer |
10.2 (up from 5 in 2016) |
|
|
Buyers who would switch for poor omnichannel experience |
54% |
|
|
Average internal stakeholders per complex purchase |
13 + 9 external |
|
|
B2B purchases stalling during the process |
86% |
|
|
Buyers dissatisfied with their chosen provider |
81% |
|
|
B2B buyers using LLMs during purchase process |
94% |
|
|
GenAI chatbots as #1 vendor shortlist influence |
17.1% |
|
|
Buyers who started research via LLMs more than Google |
29% |
|
|
Buyers preferring to engage sales only in later stages |
Two-thirds (up 17 ppt from 2024) |
|
|
Millennials and Gen Z share of B2B buyers |
71% |
|
|
Buyers who want to self-serve part or all of journey |
87% |
|
|
Analyst report usage (all buyers, 2024) |
16% — 7-year low |
|
|
Buyers expecting vendors to demonstrate problem understanding digitally |
74% |
|
|
Seller-buyer problem definition misalignment |
54.5% average |
|
|
Win rate improvement from problem alignment |
+38% |
|
|
Large B2B purchases ($1M+) via digital self-serve |
>50% |
|
|
B2B buyers spending $500K+ through self-serve or remote |
39% |
|
|
Buyers who would switch suppliers for a better experience |
75% |
Methodology and Sources
This article was compiled by aggregating statistics from Tier 1 primary research organizations and Tier 2 reputable aggregators with disclosed methodology. All statistics were traced to their original named study before inclusion. Secondary blog citations without primary source attribution were excluded. Statistics from 2023 or earlier are flagged as "most recent available data" where used.
Primary sources (Tier 1):
- 6sense — 2025 Buyer Experience Report (November 2025, n=4,510 B2B buyers, North America, EMEA, APAC); 2024 Buyer Experience Report
- McKinsey & Company — B2B Pulse Survey 2024 (n=3,942 B2B decision-makers, 13 countries); 2024 B2B Decision-Maker Pulse Survey
- Forrester — The State of Business Buying, 2024 (December 2024); The State of Business Buying, 2026 (January 2026, Buyers' Journey Survey 2025); B2B Marketing and Sales Predictions 2025 (October 2024)
- Gartner — Future of Sales 2025: Why B2B Sales Needs a Digital-First Approach (September 2020 — most recent available on this specific data point); Gartner Says By 2030 75% of B2B Buyers Will Prefer Human Interaction (August 2025)
- G2 — 2025 Buyer Behavior Report: AI Now Means Always Included (May 2025, n=1,169 B2B decision-makers, global, via BusinessWire); 2024 Buyer Behavior Report
- TrustRadius — 2025 Buyer Research: Bridging the Trust Gap; 2024 B2B Buying Disconnect: The Year of the Brand Crisis; Gen Z Buyers Report 2025
- Demandbase — 2025 B2B Buying Group Research (buying group complexity and decision-making evolution)
- Sopro — The State of Prospecting 2025 (proprietary buyer survey + aggregated primary data)
- Consensus — 2026 B2B Buyer Behavior Report (6 million buyer interactions analyzed)
- Emblaze — 2024 Seller-Buyer Alignment Research (problem definition misalignment and win rate data)
- Digital Applied — B2B Marketing Statistics 2026, aggregating Forrester, 6sense, Gartner CMO Survey with methodology disclosed
- Inbox Insight / The Insight Collective — B2B Tech Buying Behavior 2025 (n=800+ B2B buyers, US and EMEA)
- The Gartner "80% of B2B sales interactions in digital channels by 2025" prediction was made in September 2020. The underlying directional data has been confirmed by McKinsey's 2024 B2B Pulse Survey. No more recent Gartner publication supersedes this specific figure.
- Emblaze's 54.5% problem definition misalignment figure is from 2024. No 2025–2026 update was available at time of publication.
Tier 2 sources (methodology disclosed):
Recency notes:
Last updated: April 2026 We update this page quarterly. If you identify a stat that has been superseded by newer primary research, contact us and we will review and update accordingly.
.png?height=245&name=Content%20Marketing%20Statistics%20(2026).png)

